I recently put on my detective hat and tracked down a bug in network error recovery in a popular PostgreSQL library. Below, we'll walk through the process of bugfinding and iteratively making the feedback loop smaller and smaller. In order to find and fix the bug I
- Confirmed the root cause of the error at the network level via packet capture
- Wrote a bare bones client and used a Docker container running
postgresso I could reproduce the behavior - Introduced a "know-nothing" TCP proxy in between the client and database so I could introduce and expose networking faults to the client
- Zoomed in on the source of the bug once the proxy enabled 100% reproducible failure
Contents
- Signs of Trouble
- Confirming a Root Cause
- Who Is at Fault
- Synthetic Failure via TCP Proxy
- Finding the Bug
- Fixing the Bug
- Takeaways
Signs of Trouble
In our sandbox environment at Blend, there were some reports of
"broken pipe" errors showing up a few hundred times per day. Although the
error rate for this particular error was essentially zero, I was worried
this may be an issue with AWS RDS that may get worse, so I devoted a
half day1 to track it down.
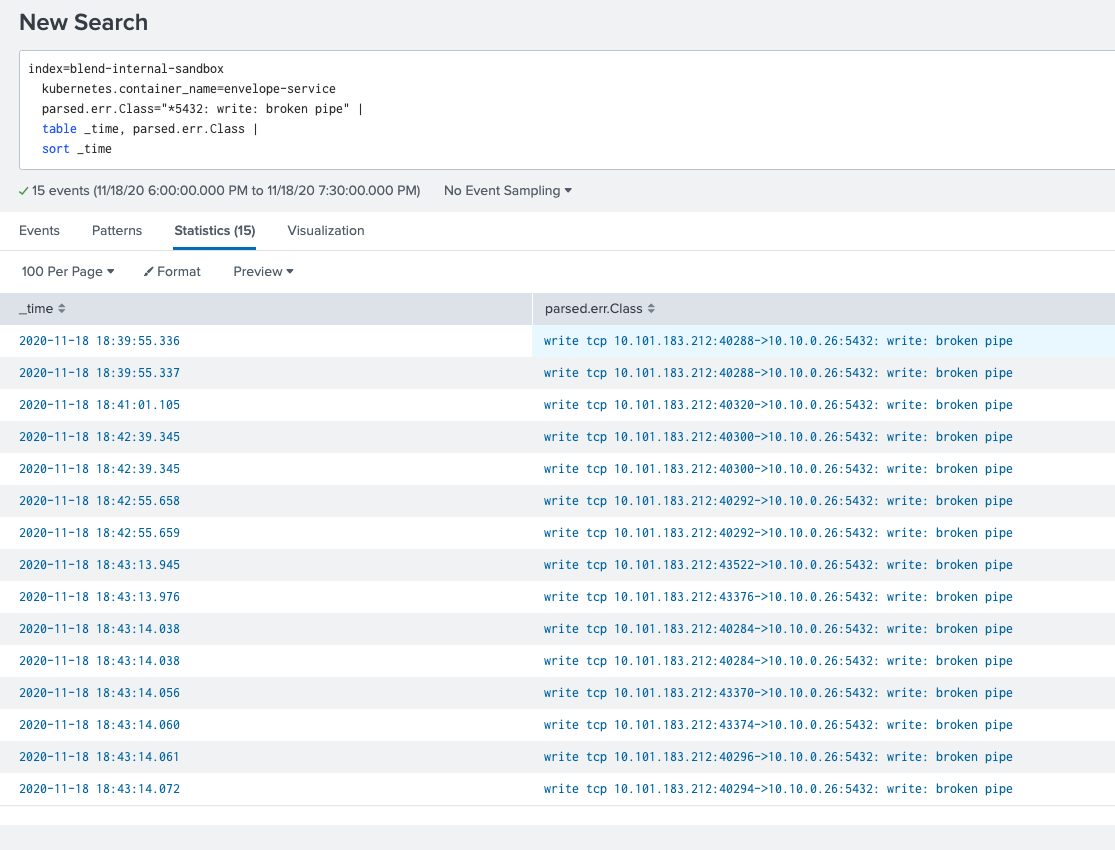
We kept seeing log lines containing write: broken pipe in a few Go
microservices. For example:
Since in sandbox, these services are often completely idle —
essentially all activity is due to end-to-end tests (E2Es) that trigger as part
of continuous deployment for related services. These broken pipe errors
appeared to occur when the services were attempting database queries after
long periods of inactivity. This was a hint that the errors were caused
by failure to gracefully manage idle connections.
Confirming a Root Cause
In order to pinpoint the exact cause of the failure I decided to set up packet capture for one of the offending services. Rather than trying to find errors across multiple pods, the first thing I did was scale the microservice down to one pod, being sure to remove the autoscaler in the process:
$ kubectl delete horizontalpodautoscaler envelope-service
horizontalpodautoscaler.autoscaling "envelope-service" deleted
$
$ kubectl scale deployment/envelope-service --replicas 1
deployment.apps/envelope-service scaled
$
$ kubectl get pods --selector app=envelope-service
NAME                               READY   STATUS        RESTARTS   AGE
envelope-service-bb5999898-5hb78   3/3     Terminating   0          6h4m
envelope-service-bb5999898-7r865   3/3     Running       2          18h
$
$ kubectl get pods --selector app=envelope-service
NAME                               READY   STATUS    RESTARTS   AGE
envelope-service-bb5999898-7r865   3/3     Running   2          18h
From there, I pointed ksniff — a kubectl plugin — at the
pod and waited until an error occurred2:
kubectl sniff \
  envelope-service-bb5999898-7r865 \
  --output-file ./ksniff-5432.pcap \
  --filter "port 5432"
I captured packets in a ninety minute window and the error log
lines started showing up around forty minutes in, from 18:39:55 to 18:43:14
UTC. In the fifteen log lines above, there are eleven
unique client ports — 40288, 40320, etc. — each corresponding
to a socket from a Go database/sql connection pool. Viewing the packet
capture we see the AWS RDS instance sent out RST (reset) packets a few minutes
before the broken pipe errors showed up. All eleven of the sockets received
an RST around 18:27:09 UTC:
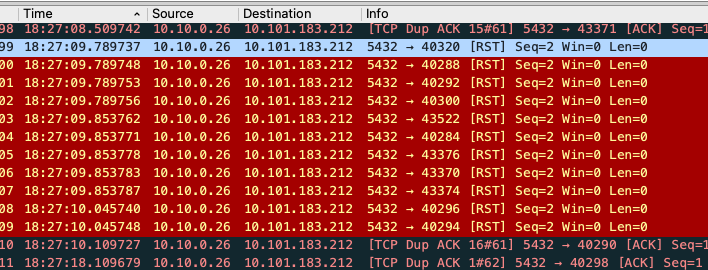
This confirmed the suspicion that the sockets had "gone bad" and that the broken pipe errors occurred on first usage after an extended idle period.
Who Is at Fault
A bit more about why the sockets had "gone bad". I was initially unhappy that
AWS RDS had sent RST packets, essentially hanging up the phone abruptly as
opposed to saying goodbye with a FIN packet to cleanly close the connection.
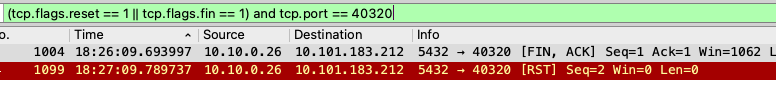
However it appears that a minute before the RST packets arrived (around
18:26:09 UTC), the AWS RDS instance attempted to send FIN packets to each
of the idle sockets. However, the client responded with an RST from a
different port in all cases (instead of handling the FIN by responding
with a FIN / ACK):
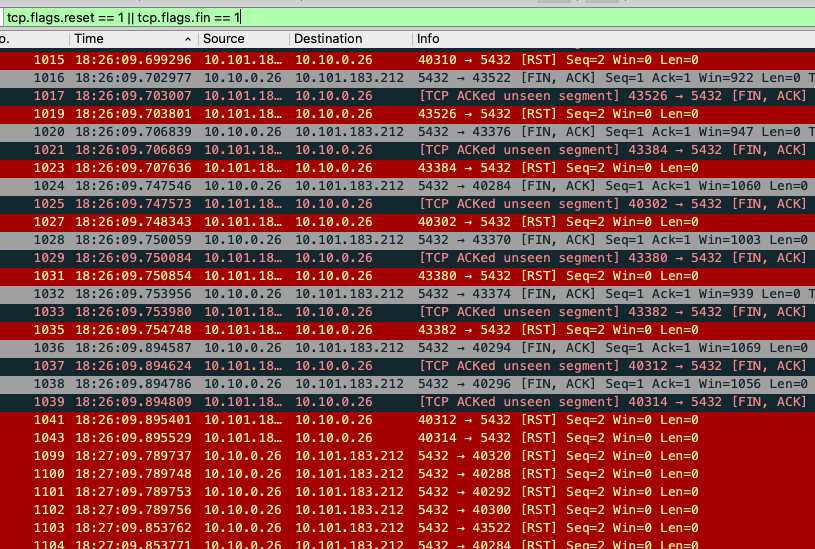
This may very well be another bug in the lib/pq Go library, but that is a
story for another day. I think it's more likely that this is a bug caused by
the fact that Istio is managing networking in the pod via iptables and
there is some kind of bungled handoff happening. For example we can see that
port 40320 receives a FIN and then an RST but never sends back a FIN or RST:
Synthetic Failure via TCP Proxy
With reasonably high certainty that the issue was caused by first-use-after-RST, it was time to massively decrease the size of the feedback loop. I needed to control three moving pieces here to be able to reproduce the conditions
- The Go client
- The
postgresserver - The "network"
In this case we don't literally need to control the network, but we
want something programmable (e.g. a proxy) so that we can send an RST without
having to reach into the blackbox of the postgres binary running in a Docker
container.
First we run the database:
docker run \
  --detach \
  --name pg-trigger-rst \
  --hostname localhost \
  --publish 13370:5432 \
  --env POSTGRES_DB=superuser_db \
  --env POSTGRES_USER=superuser \
  --env POSTGRES_PASSWORD=password \
  postgres:13.1-alpine
Next, using the github.com/lib/pq library, the broken-pipe.go
script creates a single connection and then executes the statement
SELECT 1 before and after a sleep statement. During the sleep, we expect
an RST packet to be sent. In order to ensure with a high level of certainty
that the RST packet has arrived, after the first statement the script indicates
it has gone idle by writing to a (shared) state file and then sleeps for a
second before executing the second statement. If we use the script to directly
query postgres (i.e. without a proxy):
$ go run ./broken-pipe.go --port 13370
14:48:14.355999 Setting state to ACTIVE
14:48:14.375156 Setting state to IDLE
14:48:14.375429 Sleeping for 1 second
14:48:15.376486 Done sleeping
14:48:15.379833 Setting state to COMPLETE
The last bit here is the "network". The rst-proxy.go script runs a
TCP proxy that usually shuttles packets between the Go client and the
postgres server. However, it polls the (shared) state file and once the
client has gone IDLE it closes the connection. In normal circumstances,
closing the connection would still not result in an RST, the kernel3 will send a FIN to gracefully close the connection. To modify
this behavior we must set the SO_LINGER socket option:
tc, ok := c.(*net.TCPConn)
// ...
sc, err := tc.SyscallConn()
// ...
err = sc.Control(func(fd uintptr) {
    syscall.SetsockoptLinger(
        int(fd),
        syscall.SOL_SOCKET,
        syscall.SO_LINGER,
        &syscall.Linger{Onoff: 1, Linger: 0},
    )
})
When running the rst-proxy.go script and pointing our client at the proxy
port, we can reproduce the error 100% of the time:
$ go run ./rst-proxy.go
14:48:18.799745 Setting up TCP proxy on localhost:23370
14:48:20.803298 Handling TCP connection from 127.0.0.1:57781
14:48:20.905144 State file switched to IDLE, closing connection
14:48:21.068089 Done proxying connection
$
$
$ # e.g. In another shell
$ go run ./broken-pipe.go --port 23370
14:48:20.800452 Setting state to ACTIVE
14:48:20.817998 Setting state to IDLE
14:48:20.818213 Sleeping for 1 second
14:48:21.818725 Done sleeping
14:48:21.818906 write tcp 127.0.0.1:57781->127.0.0.1:23370: write: broken pipe
exit status 1
Finding the Bug
Once I had a very small loop for reproducing the error4 it was time
to find the source of the bug. I initially assumed that database/sql in Go
would "actively" manage the connection pool and remove a connection the
moment an RST was received. The fact that the error can be reproduced
100% of the time puts that theory to rest. I also did a sanity check with the
pgx library and verified it does not have this bug, meaning that
this was a bug in lib/pq. (Despite its popularity and longevity, lib/pq is
in maintenance mode and the maintainers recommend using pgx.)
I wasn't sure where to look to find the bug and had zero familiarity with the
lib/pq codebase. So, in order zoom in on the issue I created a custom
postgres-wrapped database driver via the super helpful
github.com/ngrok/sqlmw library. In Go, a database driver is composed of
types that satisfy a small set of interfaces from database/sql and
database/sql/driver. For example the driver itself satisfies driver.Driver
and must have an Open() method that returns a connection satisfying
driver.Conn. Using ngrok/sqlmw, I was able to log every invocation of a
method from one of these interfaces, for example:
type loggingInterceptor struct {
    sqlmw.NullInterceptor
}

func (*loggingInterceptor) ConnPing(ctx context.Context, conn driver.Pinger) error {
    log.Println("ConnPing() called")
    return conn.Ping(ctx)
}

func (*loggingInterceptor) ConnExecContext(ctx context.Context, conn driver.ExecerContext, query string, args []driver.NamedValue) (driver.Result, error) {
    log.Println("ConnExecContext() called")
    return conn.ExecContext(ctx, query, args)
}

func main() {
    // ...
    sql.Register("postgres-wrapped", sqlmw.Driver(&pq.Driver{}, &loggingInterceptor{}))
    // ...
    pool, err := sql.Open("postgres-wrapped", dsn)
    // ...
}
Once I was able to determine that ExecContext() was the source of the
write: broken pipe, I started to modify ${GOPATH}/src/github.com/lib/pq
until I narrowed down the source:
pq.conn.ExecContextimplementsdriver.ExecerContext(source)pq.conn.ExecContextcallspq.conn.Exec(source)pq.conn.Execcallspq.conn.simpleExec(source)pq.conn.simpleExeccallspq.conn.send(source)pq.conn.sendfails anet.Conn.Writewith "broken pipe" and then panics (source)pq.conn.errRecover— invoked frompq.conn.Exec— handles thepanic()recovery (source)pq.conn.errRecoverhandles a*net.OpErrorby setting thebadflag to tombstone the connection but just returns the error as-is (source)
I must say I was surprised by this, using panic() / recover() essentially
amounts to try / except in other languages, a pattern that is not very
common in Go5.
Fixing the Bug
Luckily I was able to submit a fix (lib/pq#1013) that was small and
easy to reason about. This likely contributed to the quick review and merge
from the lib/pq maintainers. The fix was to explicitly mark the error
as safe to retry when we know zero bytes were written and then to return
the driver.ErrBadConn sentinel to signal to database/sql that the
connection should be removed from the pool:
diff --git a/conn.go b/conn.go
index f313c14..0d96600 100644
--- a/conn.go
+++ b/conn.go
@@ -891,9 +891,20 @@ func (cn *conn) Exec(query string, args []driver.Value) (res driver.Result, err
    return r, err
 }

+type safeRetryError struct {
+   Err error
+}
+
+func (se *safeRetryError) Error() string {
+   return se.Err.Error()
+}
+
 func (cn *conn) send(m *writeBuf) {
-   _, err := cn.c.Write(m.wrap())
+   n, err := cn.c.Write(m.wrap())
    if err != nil {
+       if n == 0 {
+           err = &safeRetryError{Err: err}
+       }
        panic(err)
    }
 }
diff --git a/error.go b/error.go
index 3d66ba7..a227e08 100644
--- a/error.go
+++ b/error.go
@@ -495,6 +495,9 @@ func (cn *conn) errRecover(err *error) {
    case *net.OpError:
        cn.bad = true
        *err = v
+   case *safeRetryError:
+       cn.bad = true
+       *err = driver.ErrBadConn
    case error:
        if v == io.EOF || v.(error).Error() == "remote error: handshake failure" {
            *err = driver.ErrBadConn
I certainly didn't come up with this idea on my own. I previously mentioned
that pgx did not have the same bug. When vetting pgx, I dug through
the source in the same way that I did with lib/pq and found that
PgConn.Exec() marks an error as safe when exactly zero bytes are
written and the high-level driver connection returns the sentinel
driver.ErrBadConn if an error is safe to retry.
Takeaways
In some sense, we should've never been down this road because lib/pq is in
maintenance mode. However, the real story here is about starting from a
wide open view of microservice logs and narrowing down all the way to a line
of library code. Additionally, the story may not be over if the RST packets are
caused by a connection handoff issue with Istio.
So what should a reader take away from this long and winding road to a bugfix?
- A first lesson in tight feedback loops: ensure the code being debugged is running in a controlled environment. Here that meant scaling the Kubernetes deployment down to one pod
- Networking bugs are not so scary, packet capture coupled with logs and Wireshark's helpful UI quickly told the story
- Another lesson in tight feedback loops: once the RST hypothesis was confirmed, control the whole stack. Throw away as many confounding factors as possible and just focus in on the problem area. Strongly prefer reproducible examples that can be run on your development machine (i.e. a develop, deploy, debug loop is not tight enough).
- Treat components as a black box when beneficial. Figuring out in fine
detail how to make
postgressend the RST could've taken a very long time, so we took the shorter path by putting a proxy in front ofpostgresthat we could fully control. - Had we used the recommended
pgx, there would have been no bug to fix; upgrade dependencies early and often and look out for deprecation notices like the one inlib/pq
- which later became a whole day ↩
- Note the filter only applies to
port 5432, the PostgreSQL port. The
.pcapfile only grew to 644KiB in ninety minutes but without a filter it would've been over 1GiB. ↩ - This part of the socket lifecycle is not managed by Go at all, but fully by the kernel. ↩
- I could've made it
smaller if I ran the proxy and the client in the same binary, but in my
initial sleuthing I was using Python for the proxy because of a great
StackOverflow answer that taught me about
SO_LINGER. ↩ - and one that carries with it the cost of stack unwinding ↩