TL;DR: Running Datadog (
dd-agent) during local development can help confirm metrics and traces are sent as expected and can help debug when things go wrong. To rundd-agentlocally just clone the dhermes/local-dd-agent1 repository andmake run.Being able to quickly iterate with a local
dd-agenthelped to quickly locate bugfixes brightcove/hot-shots#189.
Motivation
During local development, we often just turn off code that sends metrics and
traces to datadog. We just trust that our application metrics and traces will
work as expected when deployed to environments (e.g. Kubernetes) where
dd-agent is running.
This is especially challenging when things go wrong. For example, sometimes
a task will exit before flushing all metrics out to dd-agent and debugging
an application in Kubernetes is a much larger challenge than debugging it
on a development machine.
I was recently debugging a critical production issue caused by a bug in the
connection error recovery2 code in hot-shots. (At Blend we use
hot-shots, a popular open source library, as a base for connecting to Datadog
in all3 Node.js applications.) By running
dd-agent locally, I was able to reproduce the bug and with a tight feedback
loop track down three more problems with the implementation. This led to a
fix as well so we can properly recover from connection errors.
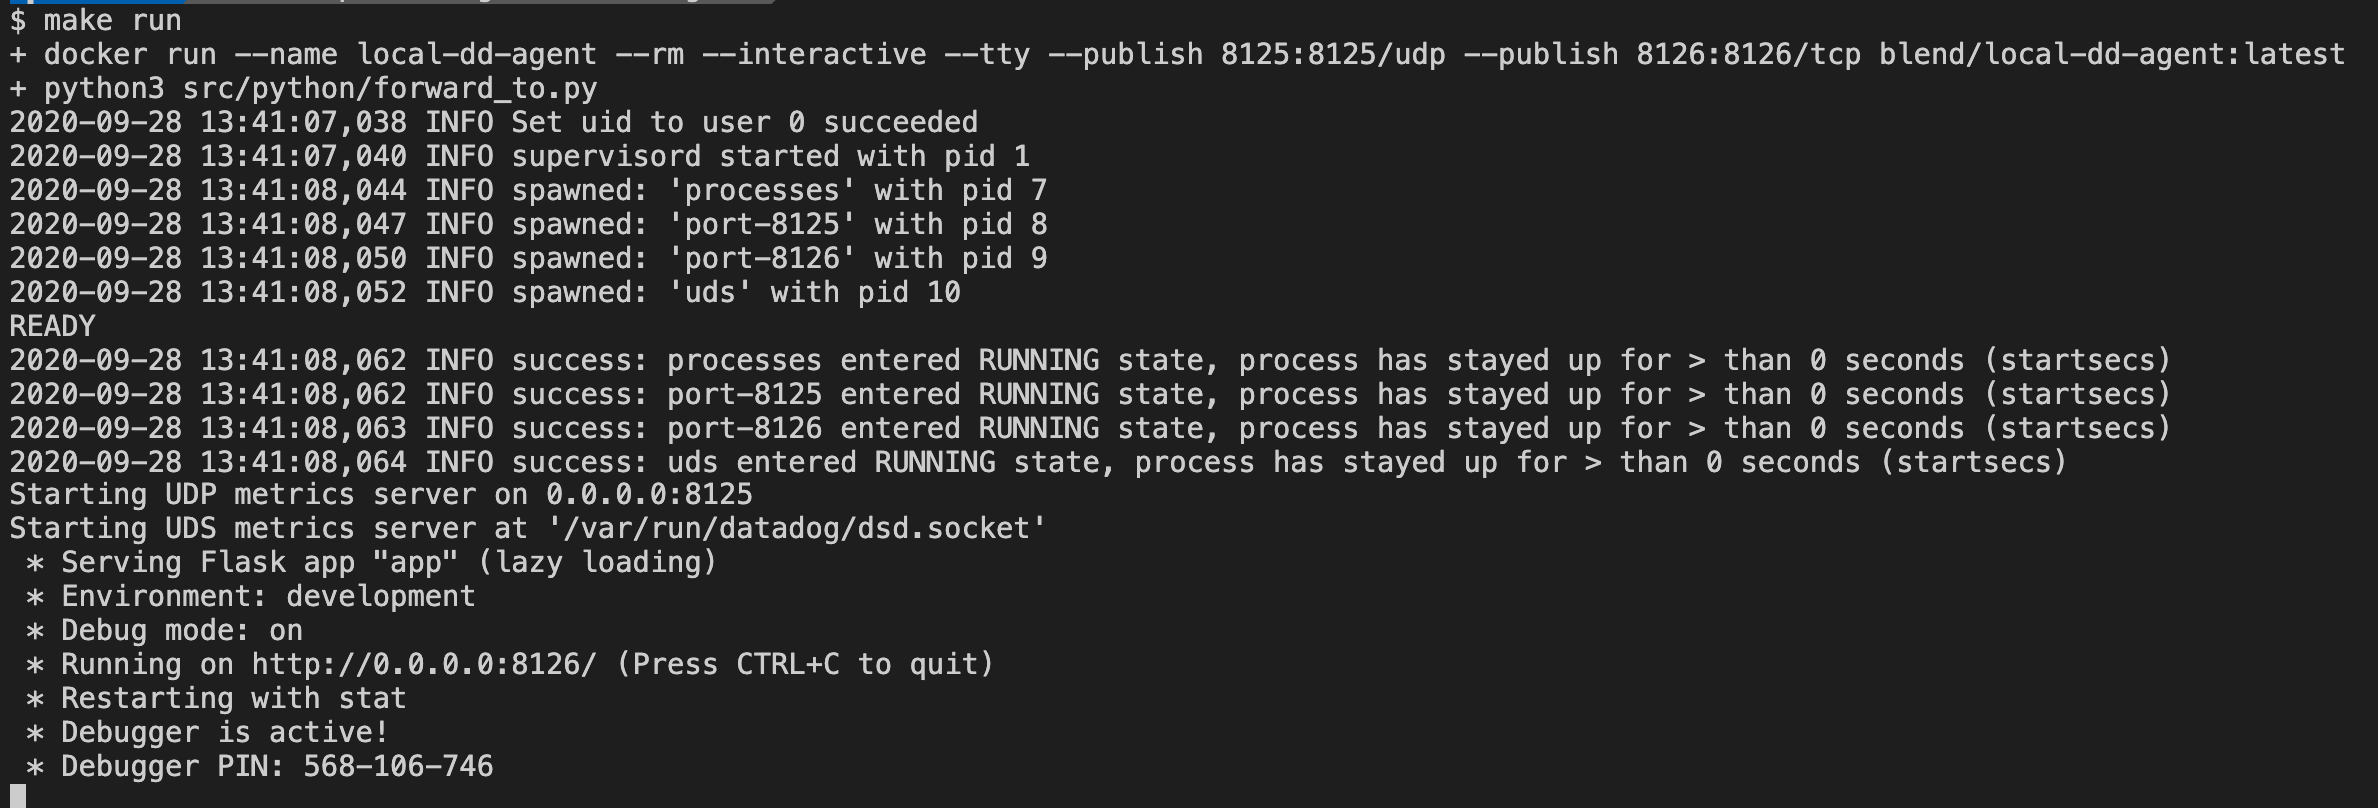
Running dd-agent
To run the dd-agent locally, clone local-dd-agent and build the Docker
container for the dd-agent application
git clone [email protected]:dhermes/local-dd-agent.git
cd local-dd-agent/
make build
then run the container via
make run
# OR:
# make run DATADOG_ADDRESS=".../custom/path/to/dsd.socket"
The start logs4 should resemble:
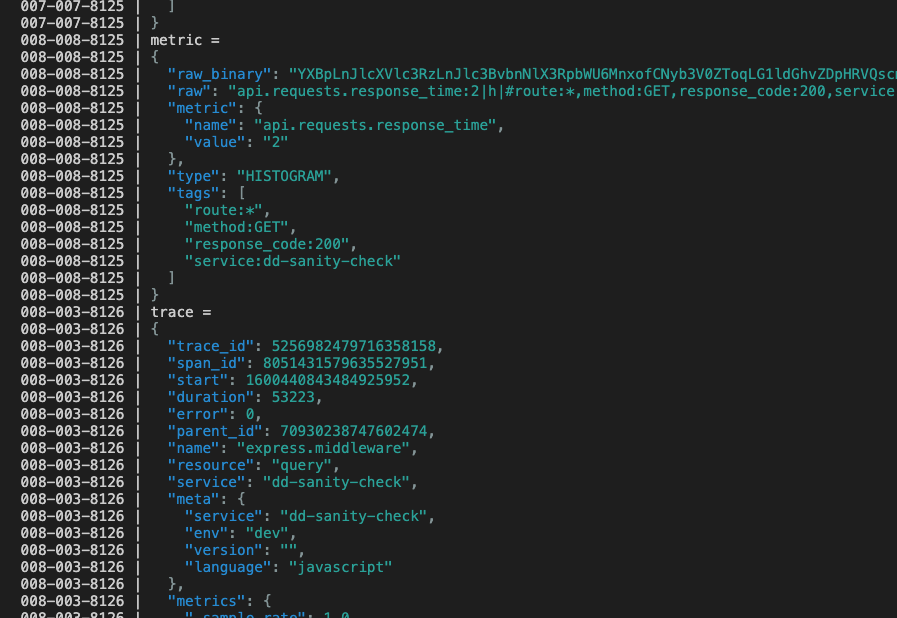
Triggering some requests to a sample application, we'd see example logs to the agent like:
Common Testing Actions
After running an application (e.g. on port 10034) it will be useful to send a "bare" request
curl http://localhost:10034
as well as a request that's part of a trace that has been opened in an upstream application
curl \
  --header 'x-datadog-trace-id: 3131313131313131313' \
  --header 'x-datadog-parent-id: 4747474747474747474' \
  http://localhost:10034
To compare to the "no dd-agent" experience, it's helpful to utilize an
environment variable (e.g. DATADOG_DISABLE) to easily disable the metrics
collector from emitting anything (i.e. make sure nothing gets sent out on port
8125 to the local-dd-agent UDP metrics listener).
Similar, having an environment variable (e.g. DATADOG_TRACE_DEBUG_MODE) can
be quite helpful to put tracing in debug mode (e.g. to debug if the trace
server on port 8126 can't be reached or APM responses are invalid):
DATADOG_TRACE_DEBUG_MODE=true npm start

# {"message":"Server listening on port 10034","level":"info","dd":{"trace_id":"4552692657769386461","span_id":"4552692657769386461","service":"dd-sanity-check","env":"dev"},"_timestamp":"2020-09-28T14:29:49.959Z"}
# Encoding trace: [{"trace_id":"3f2e69d9dddf91dd","span_id":"3f2e69d9dddf91dd","parent_id":"0000000000000000","name":"serverInit","resource":"serverInit","error":0,"meta":{"service":"dd-sanity-check","env":"dev","version":"","language":"javascript"},"metrics":{"_sample_rate":1,"_dd.agent_psr":1,"_sampling_priority_v1":1},"start":1601303389949310200,"duration":12327637,"service":"dd-sanity-check"}]
# Added encoded trace to buffer: 91 8b a8 74 72 61 63 65 5f 69 64 cf 3f 2e 69 d9 dd df 91 dd a7 73 70 61 6e 5f 69 64 cf 3f 2e 69 d9 dd df 91 dd a5 73 74 61 72 74 d3 16 38 f8 f2 f7 8e b5 00 a8 64 75 72 61 74 69 6f 6e d3 00 00 00 00 00 bc 1a d5 a5 65 72 72 6f 72 00 a9 70 61 72 65 6e 74 5f 69 64 cf 00 00 00 00 00 00 00 00 a4 6e 61 6d 65 aa 73 65 72 76 65 72 49 6e 69 74 a8 72 65 73 6f 75 72 63 65 aa 73 65 72 76 65 72 49 6e 69 74 a7 73 65 72 76 69 63 65 af 64 64 2d 73 61 6e 69 74 79 2d 63 68 65 63 6b a4 6d 65 74 61 84 a7 73 65 72 76 69 63 65 af 64 64 2d 73 61 6e 69 74 79 2d 63 68 65 63 6b a3 65 6e 76 a3 64 65 76 a7 76 65 72 73 69 6f 6e a0 a8 6c 61 6e 67 75 61 67 65 aa 6a 61 76 61 73 63 72 69 70 74 a7 6d 65 74 72 69 63 73 83 ac 5f 73 61 6d 70 6c 65 5f 72 61 74 65 cb 3f f0 00 00 00 00 00 00 ad 5f 64 64 2e 61 67 65 6e 74 5f 70 73 72 cb 3f f0 00 00 00 00 00 00 b5 5f 73 61 6d 70 6c 69 6e 67 5f 70 72 69 6f 72 69 74 79 5f 76 31 cb 3f f0 00 00 00 00 00 00
# Request to the agent: {"path":"/v0.4/traces","method":"PUT","headers":{"Content-Type":"application/msgpack","Datadog-Meta-Tracer-Version":"0.20.3","X-Datadog-Trace-Count":"1","Datadog-Meta-Lang":"nodejs","Datadog-Meta-Lang-Version":"v12.18.3","Datadog-Meta-Lang-Interpreter":"v8"},"protocol":"http:","hostname":"localhost","port":"8126"}
# Response from the agent: {}
Caveats
The code in local-dd-agent is completely handwritten and is a best effort
to map to Datadog features. There are known features not yet implemented
(e.g. parsing of _e{} / Event metric datagrams) and likely unknown
bugs or missing features (e.g. future API versions for APM).
If it doesn't work as expected, please let me know and I'll be happy to help fix bugs, advise on how to extend and do anything else to resolve.
- As of
b5b577154c7bf2c80020a0d87aa3c111e7cead8c↩ - In particular, this was for errors caused by a
failed connection to a Unix Domain Socket (UDS) usually available at
/var/run/datadog/dsd.socket. ↩ - Maybe not all? But most. ↩
- The container runs a UDP listener on port 8125 for metrics,
a TCP listener on port 8126 for traces, a UDS listener at
/var/run/datadog/dsd.socketin the container and a UDS listener at$(pwd)/var-run-datadog/dsd.socketon the host (i.e. the machine that invokeddocker run). ↩